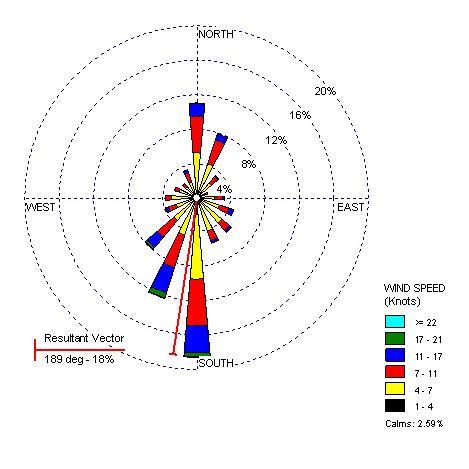

This windrose plot indicates the climate data for five areas in Washington. The color legend on the botom right indicates the wind speed symbolized by the corresponding color.
A windrose is a diagram which shows the distribution of the speed and direction of wind over a specific place and time.
No comments:
Post a Comment